
Mapping online influence at CEAC 2017
I know everyone’s heading back from the CASE Europe Annual Conference with their heads full of exciting ideas and ambitious plans for the coming year (including our own MD Pamela), but I just want to add one more thing to that list.
An event like CEAC17 – full of marketing, communications, and social media professionals – is bound to get people talking online. But who were the most vocal commenters at the conference? Who was making the most impact? Who was driving the advancement conversation this year? I decided to have a little fun…
Online influence is hard to truly measure, but at Pickle Jar we’ve got a few tools to help us visualise Twitter conversations, indicating the people who are really engaging with each other and the wider world on a given topic. I know those who attended CEAC17 will be interested to see who was taking part in those conversations, so I’ve made some influence maps of the #CEAC17 hashtag for you to explore.
Here’s an example of a how these networks look with the names removed:

When we add the names, these maps give us a snapshot of who was involved in online conversations at CEAC17. We can see groups forming around certain topics, some popular individuals who have influence on the map, and some more unusual offshoots that you might not expect.
Each circle represents an individual Twitter account. The size of a circle shows how active an account is as part of the conversation with other accounts. The better and more numerous its connections and conversations, the bigger it appears in the map. More densely connected groups of accounts are coloured the same for ease of identification. The more interconnected the conversations are, the closer they come to the centre of the map. That’s why you’ll see the CASE Europe Twitter account as the biggest and most connected account on each map.
The map for the whole week is available as a PDF download if you want to examine it in more detail yourself (or if you want to see where you ended up on the map…)

Who’s talking? (And who are they talking to?)
The CASE Europe account is a dominant influence on each map. They’re the ones running the event and curating some of the best tweets from the conference, so we’d expect to see them there.
Sometimes the map shows us which talks and sessions sparked people’s imaginations enough to generate online discussion – we can see Beth Elzer, Tricia King and Harvard University all occupying places of influence on the overall map.
Other prominent players throughout the week included those who also had a wide reach beyond the event – Phil Baty of THE, Alistair Jarvis of UUK and the Wonkhe account all show up as focal points in the conversation. These accounts form the core of a sub-community within the larger CEAC17 map, one that is more likely to discuss the political aspects of the HE sector rather than the more communications and marketing-driven topics of other sub-communities.
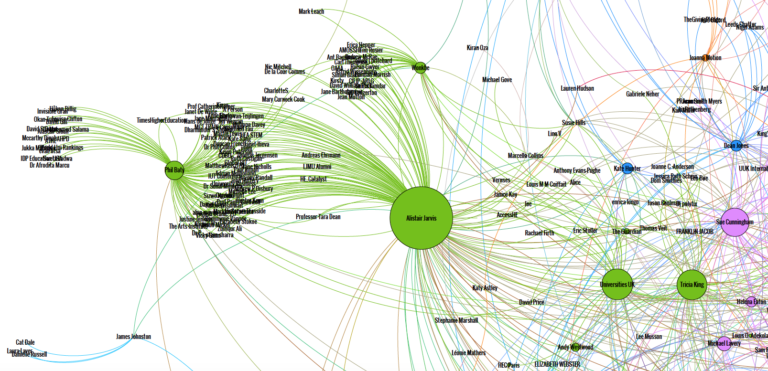
Each different coloured group of accounts usually has a slightly different set of topics that they’re likely to discuss (I’ve got this information in the data we gather to create these maps). These all take place within the overall CEAC conversation, so of course they’re still focused on education and advancement. As well as the policy wonks in green, there’s a blue group of alumni relations to the left of the main CASE Europe account:

(There’s also a dark red group close to the centre which includes several Pickle Jar people getting very involved in content strategy discussions – good work, team!)
The overall map is extremely interconnected, with so many people having conversations with others from difference disciplines and streams – as you’d find at CEAC in real life, too.
What next?
I created these maps as a fun way to look at the conversations taking place at CEAC17, but they have directly applicable uses for advancement work, too. We can identify important online influencers to engage with, or assess our own impact on a particular topic. We can use it to examine the online conversation around a campaign we’ve run, or see how far a crisis has spread. We’ve carried out this work in the past for UCL, helping them to look at online influencers in the field of dementia research.
If you want to know more about this work, or how we might be able to help you look at other ways of assessing your institution’s influence and reputation, just get in touch. We’ll be happy to help.