
Mapping online influence: Pickle Jar and UCL
It’s been true for a long time that a brand’s reputation is not what they say it is, but what other people say it is.
The democratisation of communications through social media means that anyone can speak publicly about a brand. They can do so on platforms that gather large audiences or feature high on search engine rankings. This means that anyone interested in influencing their public reputation should be prepared to monitor and assess the impact of online conversations they’re interested in.
A key part of this is understanding how networks and influence work in online communities, and how information can spread – whether it is positive or negative. Learning about your own position in these communities can help you decide whether to build your own profile or to leverage existing influence structures.
This online influence is difficult to measure – how do you decide what behaviour is “influential” in your community? How do you know what is relevant to you and your audience? Universities have so many areas in which they need to determine their own influence and that of others – research output, campus news, overseas reputation… the list could be endless.
There’s a lot of information out there about using influencer marketing to reach a wider audience – especially for sales or recruitment targets – but finding out who those influencers might be for your audience is a trickier prospect.
Asking about influence
Last year we were asked to look at this issue by UCL. UCL wanted to work out a way to measure who the most influential people in their online networks were, and who the influential people were in some specific discussion topics. They wanted to be able to replicate this work themselves in the future, so we needed to produce a methodology that was robust and – importantly – not too time-consuming.
At Pickle Jar we’ve been working with universities and colleges for nearly a decade, but this was the first time we had been asked to look at influencer assessment in this kind of detail. It was great to see an institution like UCL tackling it as part of their approach to social media strategy, and it gave us the opportunity to develop a tailored approach for them.
We carried out some early internal work with UCL to find out what the university considered to be influential online activity. Was a Facebook share equivalent to a Twitter retweet, or a regram on Instagram? Was a direct mention of a social media account name more or less valuable than mentioning the name of the university? Unsurprisingly, we found that there were nuances in the values the UCL team attributed to types of online engagement according to their potential role in helping to achieve different elements of university strategy. The process stimulated fascinating discussion among the UCL team, and allowed our approach to be unique to UCL and relevant to the way the UCL operates. It also meant that we had a consensus of opinion on the role of engagement, and a clearly documented process to help with any internal roll-out in the future.
Following this we explored various ways of gathering the data required – sometimes using UCL’s own monitoring service, and sometimes making use of other online tools. There are a lot of ways to get hold of this information, but the important thing is to find the right information – not everything is relevant.
We used this information to produce detailed influence charts identifying the top people online talking about UCL, both directly and indirectly. These charts also provided a way to determine the most popular topics these people talked about, allowing us to spot any particularly common themes among this audience.
Mapping the conversation
We were also asked to find a way to produce a visual representation of discussions on particular topics, and use these to determine UCL’s online influence in these fields. This meant approaching the influence work from the other side – starting with the topic in question and finding the influencers.
Again, we explored various ways of making this process work. In the end we used a modestly-priced data-mining tool to gather data from Twitter on mentions of particular words, then ran this through an open-source visualisation program to produce maps of the interactions. Once we had worked this out, we went back to our original influence data and created maps of some of the popular topics in those charts.
Once we had generated these maps, we used them to examine how online discussions on that topic were developing. We were able to identify important users who influenced the direction of a conversation, people who bridged different communities on Twitter, or clusters of users communicating with each other on related topics.
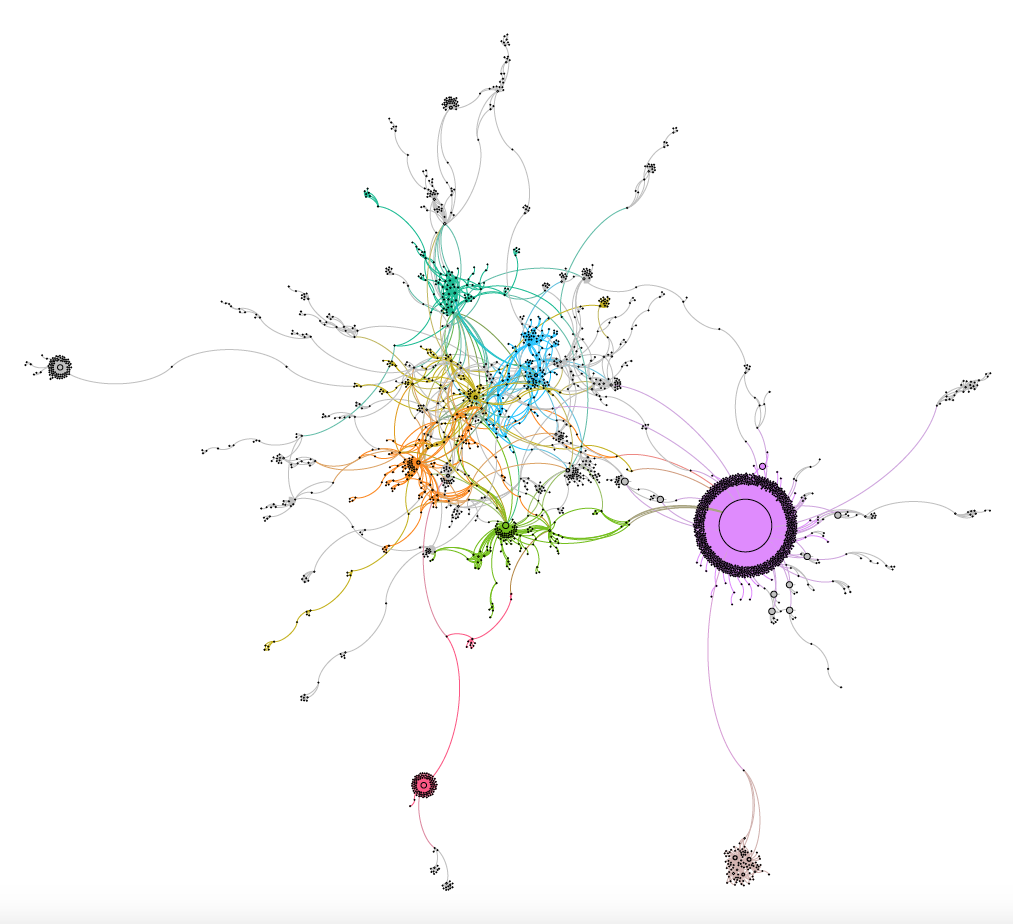
Unsurprisingly, different topics produce quite varied maps – they can be very detailed or reasonably simple, depending on the timescale covered and the popularity of the topic in question.
The map above is an example of one of the detailed networks – you can see how much is going on in different communities, identify the larger influencers, and spot the more distant clusters that might not be as relevant to UCL’s online community.
Taking it forward
From these different strands of the work we were able to define a series of different influencer categories that were relevant to the areas UCL wants to monitor, and offer some advice about what these influencers might do online and what might interest them.
Now that the work is complete, UCL is planning to incorporate the information into their strategic approach to social media, including how to get more out of their existing social media monitoring tools – and where else they might need to invest time and resources. We’re looking forward to seeing what they do next with it…